使用d3.js的javascript极地散点图 [英] javascript polar scatter plot using d3.js
问题描述
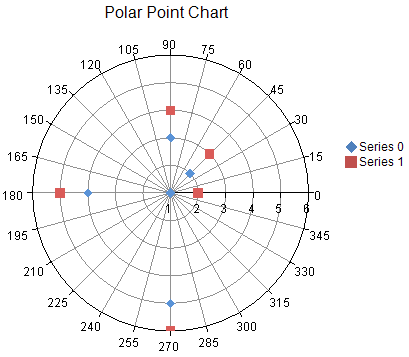
我正在尝试像这样一个简单的极坐标散点图: http://helpcentral.componentone.com/NetHelp/SpreadNet6/WF/artwork/plottypes-polar-point2.png
I'm trying to do a simple polar scatter plot like this one : http://helpcentral.componentone.com/NetHelp/SpreadNet6/WF/artwork/plottypes-polar-point2.png
我找到答案使用D3.js的极坐标图,但我无法显示点而不是d3.svg.line.radial。
如何将行更改为点?
I found that answer Polar plots using D3.js but I cannot display the points instead of d3.svg.line.radial. How do I change the line to points?
推荐答案
如果您使用 d3 .svg.line.radial()生成极坐标图,一个简单的解决方案是解析生成的路径以获取点坐标,然后在这些坐标处添加一个圆:
If you are using the d3.svg.line.radial() to generate you polar plot, one easy solution would be to parse the generated path to get point coordinates, then add a circle at those coordinates:
var line = d3.svg.line.radial()
  .radius(function(d) {
    return r(d[1]);
  })
  .angle(function(d) {
    return -d[0] + Math.PI / 2;
  });

svg.selectAll("point")
  .data(data)
  .enter()
  .append("circle")
  .attr("class", "point")
  .attr("transform", function(d) {
    // use the line function and parse out the coordinates
    var coors = line([d]).slice(1).slice(0, -1);
    return "translate(" + coors + ")"
  })
  .attr("r", 8);
以下是一个完整的工作示例:
Here's a full working example:
<!DOCTYPE html>
<meta charset="utf-8">
<style>
  .frame {
    fill: none;
    stroke: #000;
  }

  .axis text {
    font: 10px sans-serif;
  }

  .axis line,
  .axis circle {
    fill: none;
    stroke: steelblue;
    stroke-dasharray: 4;
  }

  .axis:last-of-type circle {
    stroke: steelblue;
    stroke-dasharray: none;
  }

  .line {
    fill: none;
    stroke: orange;
    stroke-width: 3px;
  }
</style>

<body>
  <script src="//d3js.org/d3.v3.min.js"></script>
  <script>
    var width = 960,
      height = 500,
      radius = Math.min(width, height) / 2 - 30;

    var r = d3.scale.linear()
      .domain([0, 1])
      .range([0, radius]);

    var line = d3.svg.line.radial()
      .radius(function(d) {
        return r(d[1]);
      })
      .angle(function(d) {
        return -d[0] + Math.PI / 2;
      });

    var svg = d3.select("body").append("svg")
      .attr("width", width)
      .attr("height", height)
      .append("g")
      .attr("transform", "translate(" + width / 2 + "," + height / 2 + ")");

    var gr = svg.append("g")
      .attr("class", "r axis")
      .selectAll("g")
      .data(r.ticks(3).slice(1))
      .enter().append("g");

    gr.append("circle")
      .attr("r", r);

    var ga = svg.append("g")
      .attr("class", "a axis")
      .selectAll("g")
      .data(d3.range(0, 360, 30))
      .enter().append("g")
      .attr("transform", function(d) {
        return "rotate(" + -d + ")";
      });

    ga.append("line")
      .attr("x2", radius);

    var color = d3.scale.category20();

    var line = d3.svg.line.radial()
      .radius(function(d) {
        return r(d[1]);
      })
      .angle(function(d) {
        return -d[0] + Math.PI / 2;
      });

    var data = [
      [Math.PI / 3, Math.random()],
      [Math.PI / 6, Math.random()],
      [0 * Math.PI, Math.random()],
      [(11 * Math.PI) / 6, Math.random()],
      [(5 * Math.PI / 3), Math.random()],
      [(3 * Math.PI) / 2, Math.random()],
      [(4 * Math.PI / 3), Math.random()],
      [(7 * Math.PI) / 6, Math.random()],
      [Math.PI, Math.random()],
      [(5 * Math.PI) / 6, Math.random()],
      [(2 * Math.PI) / 3, Math.random()],
      [Math.PI / 2, Math.random()]
    ]

    svg.selectAll("point")
      .data(data)
      .enter()
      .append("circle")
      .attr("class", "point")
      .attr("transform", function(d) {
        var coors = line([d]).slice(1).slice(0, -1);
        return "translate(" + coors + ")"
      })
      .attr("r", 8)
      .attr("fill",function(d,i){
        return color(i);
      });

  </script>
或者,你可以用一点三角法来做:
Alternatively, you could do it with a little trigonometry:
.attr("transform", function(d) {
    // get angle and radius
    var an = d[0],
      ra = r(d[1]),
      x = ra * Math.cos(an * Math.PI / 180),
      y = ra * Math.sin(an * Math.PI / 180);
    return "translate(" + [x, y] + ")";
})
运行代码:
<!DOCTYPE html>
<meta charset="utf-8">
<style>
  .frame {
    fill: none;
    stroke: #000;
  }

  .axis text {
    font: 10px sans-serif;
  }

  .axis line,
  .axis circle {
    fill: none;
    stroke: steelblue;
    stroke-dasharray: 4;
  }

  .axis:last-of-type circle {
    stroke: steelblue;
    stroke-dasharray: none;
  }

  .line {
    fill: none;
    stroke: orange;
    stroke-width: 3px;
  }
</style>

<body>
  <script src="//d3js.org/d3.v3.min.js"></script>
  <script>
    var width = 960,
      height = 500,
      radius = Math.min(width, height) / 2 - 30;

    var r = d3.scale.linear()
      .domain([0, 1])
      .range([0, radius]);

    var line = d3.svg.line.radial()
      .radius(function(d) {
        return r(d[1]);
      })
      .angle(function(d) {
        return -d[0] + Math.PI / 2;
      });

    var svg = d3.select("body").append("svg")
      .attr("width", width)
      .attr("height", height)
      .append("g")
      .attr("transform", "translate(" + width / 2 + "," + height / 2 + ")");

    var gr = svg.append("g")
      .attr("class", "r axis")
      .selectAll("g")
      .data(r.ticks(3).slice(1))
      .enter().append("g");

    gr.append("circle")
      .attr("r", r);

    var ga = svg.append("g")
      .attr("class", "a axis")
      .selectAll("g")
      .data(d3.range(0, 360, 30))
      .enter().append("g")
      .attr("transform", function(d) {
        return "rotate(" + -d + ")";
      });

    ga.append("line")
      .attr("x2", radius);

    var color = d3.scale.category20();

    var line = d3.svg.line.radial()
      .radius(function(d) {
        return r(d[1]);
      })
      .angle(function(d) {
        return -d[0] + Math.PI / 2;
      });

    var data = [
      [Math.PI / 3, Math.random()],
      [Math.PI / 6, Math.random()],
      [0 * Math.PI, Math.random()],
      [(11 * Math.PI) / 6, Math.random()],
      [(5 * Math.PI / 3), Math.random()],
      [(3 * Math.PI) / 2, Math.random()],
      [(4 * Math.PI / 3), Math.random()],
      [(7 * Math.PI) / 6, Math.random()],
      [Math.PI, Math.random()],
      [(5 * Math.PI) / 6, Math.random()],
      [(2 * Math.PI) / 3, Math.random()],
      [Math.PI / 2, Math.random()]
    ]

    svg.selectAll("point")
      .data(data)
      .enter()
      .append("circle")
      .attr("class", "point")
      .attr("transform", function(d) {
        // get angle and radius
        var an = d[0],
          ra = r(d[1]),
          x = ra * Math.cos(an),
          y = ra * Math.sin(an);
        return "translate(" + [x, y] + ")";
      })
      .attr("r", 8)
      .attr("fill",function(d,i){
        return color(i);
      });

  </script>
这篇关于使用d3.js的javascript极地散点图的文章就介绍到这了,希望我们推荐的答案对大家有所帮助,也希望大家多多支持IT屋!
