在Matlab中用渐变灰度颜色绘制圆 [英] plot circle with gradient gray scale color in matlab
本文介绍了在Matlab中用渐变灰度颜色绘制圆的处理方法,对大家解决问题具有一定的参考价值,需要的朋友们下面随着小编来一起学习吧!
问题描述
我想在Matlab中绘制带有渐变颜色的圆,但是我不能.有没有人可以帮助我?
I want to draw a circle with gradient color in matlab, but I can't. Is there any one that can help me?
推荐答案
这是一种方法-
N = 200; %// this decides the size of image
[X,Y] = meshgrid(-1:1/N:1, -1:1/N:1) ;
nrm = sqrt(X.^2 + Y.^2);
out = uint8(255*(nrm/min(nrm(:,1)))); %// output image

figure, imshow(out) %// show image
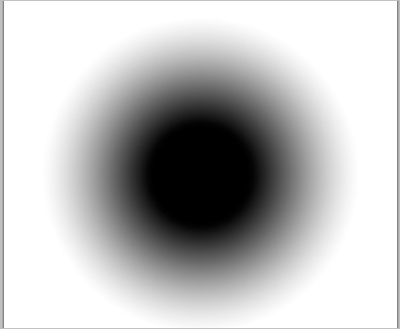
输出-
如果您希望用白色边框填充输出(如预期输出图像所示),则可以使用
If you would like to pad the output with white boundary as shown in the expect output image, you can do so with padarray -
padsize = 50; %// decides the boundary width
out = padarray(out,[padsize padsize],255);
这篇关于在Matlab中用渐变灰度颜色绘制圆的文章就介绍到这了,希望我们推荐的答案对大家有所帮助,也希望大家多多支持IT屋!
查看全文
