决策树是以树的形式表示选择及其结果的图表.图中的节点表示事件或选择,图的边表示决策规则或条件.它主要用于使用R的机器学习和数据挖掘应用程序.
使用决策树的例子是 : 将电子邮件预测为垃圾邮件或非垃圾邮件,预测肿瘤是癌症或根据每个因素中的因素预测贷款是好的还是坏的信用风险.通常,使用也称为训练数据的观察数据创建模型.然后使用一组验证数据来验证和改进模型. R具有用于创建和可视化决策树的包.对于新的预测变量集,我们使用此模型来确定数据的类别(是/否,垃圾邮件/非垃圾邮件).
R包 "party"用于创建决策树.
在R控制台中使用以下命令安装包.您还必须安装依赖包.如果有的话.
install.packages("party")包"party"具有函数 ctree(),用于创建和分析decison树.
在R中创建决策树的基本语法是 :
ctree(formula,data)
以下是所用参数的说明及减号;
公式是描述预测变量和响应变量的公式.
数据是名称使用的数据集.
我们将使用R in-built名为 readingSkills 的数据集用于创建决策树.如果我们知道变量"age","shoesize","score"以及该人是否是母语者,它会描述某人阅读技能的分数.
以下是样本数据.
# Load the party package. It will automatically load other
# dependent packages.
library(party)

# Print some records from data set readingSkills.
print(head(readingSkills))
当我们执行上面的代码时,它产生以下结果和图表 :
  nativeSpeaker   age   shoeSize      score
1           yes     5   24.83189   32.29385
2           yes     6   25.95238   36.63105
3            no    11   30.42170   49.60593
4           yes     7   28.66450   40.28456
5           yes    11   31.88207   55.46085
6           yes    10   30.07843   52.83124
Loading required package: methods
Loading required package: grid
...............................
...............................
我们将使用 ctree ()创建决策树并查看其图形的函数.
# Load the party package. It will automatically load other
# dependent packages.
library(party)

# Create the input data frame.
input.dat <- readingSkills[c(1:105),]

# Give the chart file a name.
png(file = "decision_tree.png")

# Create the tree.
  output.tree <- ctree(
  nativeSpeaker ~ age + shoeSize + score,
  data = input.dat)

# Plot the tree.
plot(output.tree)

# Save the file.
dev.off()
当我们执行上面的代码时,它产生以下结果 :
null device
          1
Loading required package: methods
Loading required package: grid
Loading required package: mvtnorm
Loading required package: modeltools
Loading required package: stats4
Loading required package: strucchange
Loading required package: zoo

Attaching package: ‘zoo’

The following objects are masked from ‘package:base’:

   as.Date, as.Date.numeric

Loading required package: sandwich
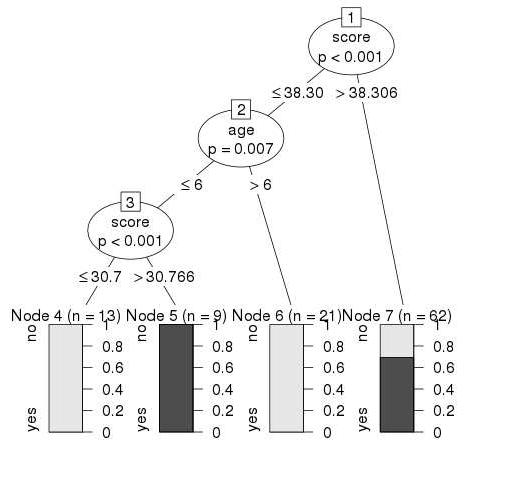
从上面显示的决策树中我们可以得出结论,任何阅读技能得分低于38.3且年龄超过6的人都不是本地发言人.