在本章中,我们将展示使用Angular中的Google Chart API绘制图表所需的配置.
按照以下步骤更新我们在 Angular 6 - Project Setup 章节中创建的Angular应用程序
| Step | 描述 |
|---|---|
| 1 | 创建一个名为 googleChartsApp的项目</>> Angular 6 - Project Setup 章节中解释. |
| 2 | 修改 app.module.ts , app.component.ts 和 app.component.html ,如下所述.保持其余文件不变. |
| 3 | 编译并运行应用程序以验证实现逻辑的结果. |
以下是修改过的模块描述符的内容 app.module.ts .
import { BrowserModule } from '@angular/platform-browser';
import { NgModule } from '@angular/core';
import { AppComponent } from './app.component';
import { GoogleChartsModule } from 'angular-google-charts';
@NgModule({
   declarations: [
      AppComponent
   ],
   imports: [
      BrowserModule,GoogleChartsModule
   ],
   providers: [], bootstrap: [AppComponent]
})
export class AppModule { }
以下是修改后的内容HTML主机文件 app.component.html .
<google-chart #chart
   [title]="title"
   [type]="type"
   [data]="data"
   [columnNames]="columnNames"
   [options]="options"
   [width]="width"
   [height]="height">
</google-chart>
在理解配置后,我们会在最后看到更新的app.component.ts.
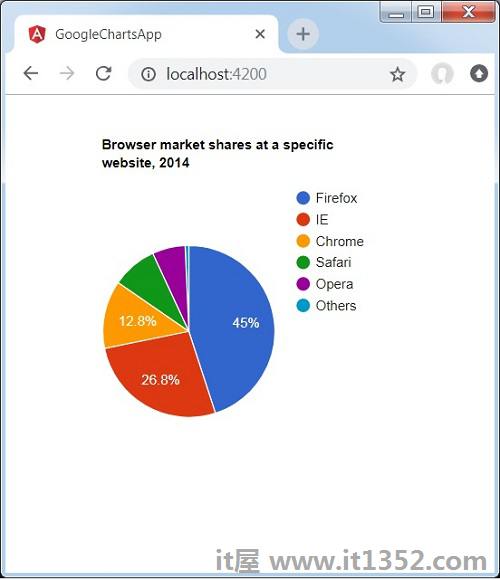
title = 'Browser market shares at a specific website, 2014';
type ='PieChart';
配置要在图表上显示的数据.
data = [
   ['Firefox', 45.0],
   ['IE', 26.8],
   ['Chrome', 12.8],
   ['Safari', 8.5],
   ['Opera', 6.2],
   ['Others', 0.7]
];
配置要显示的列名.
columnNames = ['Browser', 'Percentage'];
配置其他选项.
options = {
   colors: ['#e0440e', '#e6693e', '#ec8f6e', '#f3b49f', '#f6c7b6'], is3D: true
};请考虑以下示例以进一步了解配置语法 :
app.component.ts
import { Component } from '@angular/core';
@Component({
   selector: 'app-root',
   templateUrl: './app.component.html',
   styleUrls: ['./app.component.css']
})
export class AppComponent {
   title = 'Browser market shares at a specific website, 2014';
   type = 'PieChart';
   data = [
      ['Firefox', 45.0],
      ['IE', 26.8],
      ['Chrome', 12.8],
      ['Safari', 8.5],
      ['Opera', 6.2],
      ['Others', 0.7]
   ];
   columnNames = ['Browser', 'Percentage'];
   options = {
   };
   width = 550;
   height = 400;
}验证结果.