在本章中,我们将展示使用GWT中的Google Charts API绘制图表所需的配置.
按照以下步骤更新我们在 GWT中创建的GWT应用程序 - 创建应用程序章节 :
| Step | 描述 |
|---|---|
| 1 | 在包 com下创建名为 HelloWorld 的项目. it1352,如 GWT - 创建应用程序章节中所述. |
| 2 | 修改 HelloWorld.gwt.xml , HelloWorld.html 和 HelloWorld.java 如下所述.保持其余文件不变. |
| 3 | 编译并运行应用程序以验证实现的逻辑的结果. |
以下是修改后的模块描述符的内容 src/com.it1352/HelloWorld.gwt.xml.
<?xml version = "1.0" encoding = "UTF-8"?>
<module rename-to = 'helloworld'>
   <inherits name = 'com.google.gwt.user.User'/>
   <inherits name = 'com.google.gwt.user.theme.clean.Clean'/>
   <entry-point class = 'com.IT屋.client.HelloWorld'/>
   <inherits name="com.googlecode.gwt.charts.Charts"/>
   <source path = 'client'/>
   <source path = 'shared'/>
</module>
以下是修改过的HTML主机文件的内容 war/HelloWorld.html .
<html>
   <head>
      <title>GWT Highcharts Showcase</title>
      <link rel = "stylesheet" href = "HelloWorld.css"/>
      <script language = "javascript" src = "helloworld/helloworld.nocache.js">
   </head>
   <body>
   </body>
</html>
在理解配置后,我们最终会看到更新的HelloWorld.java.
使用ChartLoader加载库,然后创建图表.
ChartLoader chartLoader = new ChartLoader(ChartPackage.CORECHART);
chartLoader.loadApi(new Runnable() {
   public void run() {
      // Create and attach the chart
      PieChart chart = new PieChart();
   }
});通过创建数据表来配置详细信息.
// Prepare the data
DataTable data = DataTable.create();
data.addColumn(ColumnType.STRING, "Browser");
data.addColumn(ColumnType.NUMBER, "Percentage");
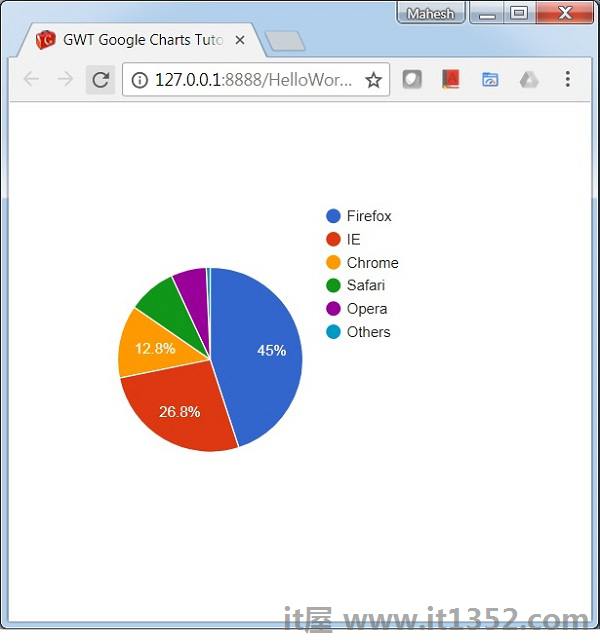
data.addRow("Firefox", 45.0);
data.addRow("IE", 26.8);
data.addRow("Chrome", 12.8);
data.addRow("Safari", 8.5);
data.addRow("Opera", 6.2);
data.addRow("Others", 0.7);
// Draw the chart
chart.draw(data);配置要设置的宽度和高度.
chart.setWidth("700px");
chart.setHeight("700px");我们将图表添加到根面板.
RootPanel.get().add(chart);
请考虑以下示例以进一步了解配置语法 :
HelloWorld.java
package com.it1352.client;
import com.google.gwt.core.client.EntryPoint;
import com.google.gwt.user.client.ui.RootPanel;
import com.googlecode.gwt.charts.client.ChartLoader;
import com.googlecode.gwt.charts.client.ChartPackage;
import com.googlecode.gwt.charts.client.ColumnType;
import com.googlecode.gwt.charts.client.DataTable;
import com.googlecode.gwt.charts.client.corechart.PieChart;

public class HelloWorld implements EntryPoint {
   private PieChart chart;

   private void initialize() {
      ChartLoader chartLoader = new ChartLoader(ChartPackage.CORECHART);
      chartLoader.loadApi(new Runnable() {
         public void run() {
            // Create and attach the chart
            chart = new PieChart();
            RootPanel.get().add(chart);
            draw();
         }
      });
   }
   private void draw() {
      // Prepare the data
      DataTable data = DataTable.create();
      data.addColumn(ColumnType.STRING, "Browser");
      data.addColumn(ColumnType.NUMBER, "Percentage");
      data.addRow("Firefox", 45.0);
      data.addRow("IE", 26.8);
      data.addRow("Chrome", 12.8);
      data.addRow("Safari", 8.5);
      data.addRow("Opera", 6.2);
      data.addRow("Others", 0.7);

      // Draw the chart
      chart.draw(data);
      chart.setWidth("400px");
      chart.setHeight("400px");
   }
   public void onModuleLoad() {
      initialize();
}}验证结果.