Asp图表,X轴为时间间隔 [英] Asp Chart, X axis as Time inteval
问题描述
我正在每5分钟从一个包含各种传感器信息的数据库中检索数据.所以我有这种类型的数据:
2011年9月11日10:00:00 450.00 130.00 ...
2011年11月11日10:05:00 480.00 120.00 ...
2011年11月11日10:10:00 455.00 131.00 ...
但是我想以每1个小时(X轴)而不是每5分钟绘制一次时间"图,但要保持数据介于两者之间.
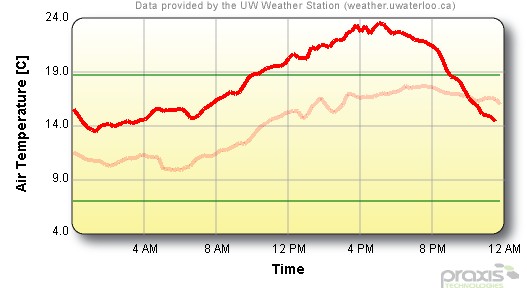
前任.我想要的方式:
http://weather.uwaterloo.ca/download/AirTemp_0.jpg
Hi,
I am retrieving data from a database which contains information of various sensors every 5 minutes. So I have this type of data:
09/11/2011 10:00:00 450.00 130.00 ...
09/11/2011 10:05:00 480.00 120.00 ...
09/11/2011 10:10:00 455.00 131.00 ...
But I want to graph the Time every 1 hour (X axis) instead of every 5 minutes but keeping the data in between.
Ex. of how I want it:
http://weather.uwaterloo.ca/download/AirTemp_0.jpg
推荐答案
设置x轴IntervalType到Hours.
这篇关于Asp图表,X轴为时间间隔的文章就介绍到这了,希望我们推荐的答案对大家有所帮助,也希望大家多多支持IT屋!
