什么会导致Valgrind堆栈跟踪中出现奇怪的地址? [英] What can cause strange addresses in a Valgrind stack trace?
问题描述
(此问题与从valgrind输出中过滤掉垃圾)
我正在尝试调试一个大型项目,该项目主要是我无法控制的---这是一个代码库的分支,大约有几百万行代码,尽管大多数可能不是与我正在研究的小部分相关.由于手工检查非常困难,因此我尝试使用valgrind来跟踪泄漏.
I'm trying to debug memory leaks in a large project that is mostly out of my hands --- it's a fork of a codebase that's on the order of millions of lines of code, although most of it probably isn't relevant to the small section that I'm working on. Since it would be very tough to look through it by hand, I'm trying to use valgrind to track down the leaks.
问题在于堆栈跟踪看起来像这样:
The problem is that the stack traces look like this:
==83597== 920 bytes in 1 blocks are possibly lost in loss record 750 of 864
==83597==    at 0x4C2AB80: malloc (in /usr/lib/valgrind/vgpreload_memcheck-amd64-linux.so)
==83597==    by 0x548EF93: myproject_malloc (mysourcefile.c:48)
==83597==    by 0x4F13FD5: ??? (in /path/to/project/library-version.so)
==83597==    by 0xFFEFFFD5F: ???
==83597==    by 0x38F: ???
==83597==    by 0xFFEFFFE5F: ???
==83597==    by 0xF: ???
==83597==    by 0x54542FF: ??? (in /path/to/project/library-version.so)
==83597==    by 0x4F536CA: ??? (in /path/to/project/library-version.so)
==83597==    by 0x64B981F: ???
==83597==    by 0xF: ???
==83597==    by 0x54542FF: ??? (in /path/to/project/library-version.so)
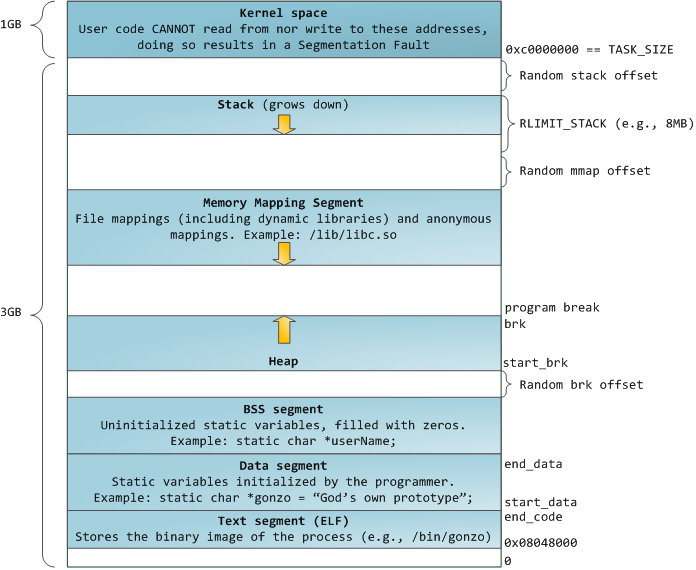
是什么原因导致了诸如0xF,0x38F等小地址的出现?我正在使用Debian风格的x86_64 Linux发行版.我找不到x86_64的参考,但据我所知 ,真正的数据要等到更高的地址后才能开始.
What might be causing the tiny addresses like 0xF, 0x38F, etc? I'm on a Debian-flavored x86_64 Linux distro. I can't find a reference for x86_64 but as far as I can tell, real data shouldn't start until a much higher address.
推荐答案
问题是Makefile正在打开fomit-frame-pointer.
The issue was that a Makefile was turning on fomit-frame-pointer.
这篇关于什么会导致Valgrind堆栈跟踪中出现奇怪的地址?的文章就介绍到这了,希望我们推荐的答案对大家有所帮助,也希望大家多多支持IT屋!
