您可以在d3中创建具有不同切片大小的饼图吗? [英] Can you create a pie chart with varying slice sizes in d3?
问题描述
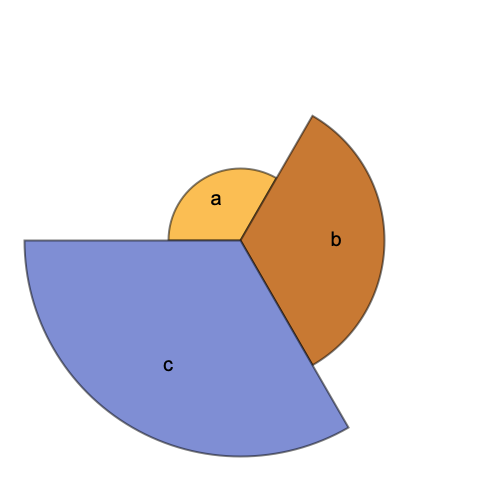
我正在尝试在d3中制作Wolfram的SectorChart(
I'm trying to make something like Wolfram's SectorChart in d3 (https://reference.wolfram.com/language/ref/Files/SectorChart.en/O_5.png). I'm currently using a basic data set of
[ { label:0, radius:1 }, { label:1, radius:1 }, { label:2, radius:2 }];
并且我正在尝试使用以下函数更改圆弧的外半径
and I'm trying to vary the outer radius of the arc with the following function
var arc = d3.arc()
      .innerRadius(0)
      .outerRadius(function(d) { return d.radius * 100; })
但这不起作用.甚至有可能在d3中执行此操作?如果是这样,我在正确的道路上吗?谢谢
But this is not functional. Is it even possible to do this in d3? If so, am I on the right path? Thanks
推荐答案
是的,您可以
您所缺少的是,您无法直接访问d.radius,因为将饼图布局应用于数据,这会将旧数据包装到data属性,因此您的代码应像这样
what you are missing is, that you can't access directly d.radius because pie layout is applied to the data, which wraps old data to the data property, so your code should be like this
var arc = d3.arc()
      .innerRadius(0)
      .outerRadius(function(d) { return d.data.radius * 100; })
提琴
var arc = d3.svg.arc()
  .innerRadius(0)
  .outerRadius(function (d,i) {
      return d.data.radius*100
  });


  var pie = d3.layout.pie()
    .sort(null)
    .value(function(d) { return d.radius; });

 var svg =  d3.select('#result').append('svg').attr('width',500).attr('height',500)

 svg.selectAll('path')
    .data(pie([{ label:0, radius:1 }, { label:1, radius:1 }, { label:2, radius:2 }]))
    .enter()
    .append('path')
    .attr('d',arc)
    .attr('transform','translate(250,250)')
    .attr('fill','yellow')
    .attr('stroke','black')
<script src="https://cdnjs.cloudflare.com/ajax/libs/d3/3.4.11/d3.min.js"></script>
<div id='result'>

</div>
这篇关于您可以在d3中创建具有不同切片大小的饼图吗?的文章就介绍到这了,希望我们推荐的答案对大家有所帮助,也希望大家多多支持IT屋!
