生产中的 Postgres 查询导致磁盘读取 I/O 异常高 [英] Postgres queries in production results in abnormally high disk read I/O
问题描述
我将 Ubuntu 16.04 与 PostgreSQL 9.5 和 Django 1.11 一起使用
I'm using Ubuntu 16.04 with PostgreSQL 9.5 and Django 1.11
我的网站一直在遭受超长的 ajax 调用(在某些情况下超过 30 秒).相同的 ajax 调用在开发过程中大约需要 500 毫秒.
My website has been suffering from super long ajax calls (upwards of 30 seconds in some cases). The same ajax calls take about 500ms in development.
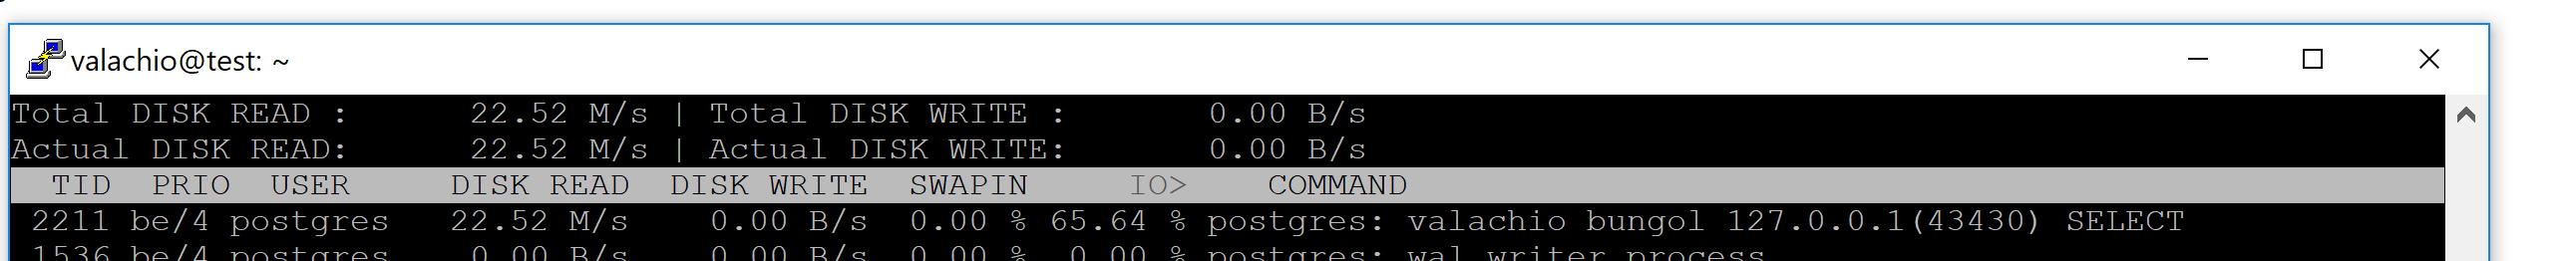
该问题与磁盘读取 I/O 相关.在生产中执行单个查询驱动磁盘读取 I/O 高达 25MB/s;开发中的相同查询导致磁盘读取 I/O 低于 0.01 MB/s.代码和查询在生产/开发中是相同的.
The problem is correlated with disk read I/O. Doing a single query in production drives the disk read I/O up to 25MB/s; an identical query in development results in less than 0.01 MB/s of disk read I/O. The code and query are identical in production/development.
因此生产中的 postgres 导致磁盘读取 I/O 异常高.可能是什么?
So something with postgres in production is causing abnormally high disk read I/O. What could it be?
这是一个示例查询,在生产中需要大约 25 秒,而在开发中仅需要 500 毫秒:
Here is an example query that takes ~25 seconds in production, and only 500ms in development:
EXPLAIN (ANALYZE, BUFFERS)
SELECT COUNT(*) AS "__count" FROM "map_listing"
WHERE ("map_listing"."lo" <  -79.32516245458987 AND "map_listing"."la" > 43.640279060122346
AND "map_listing"."lo" >  -79.60531382177737 AND "map_listing"."transaction_type" = 'Sale'
AND "map_listing"."la" < 43.774544561921296
AND NOT ("map_listing"."status" = 'Sld' AND "map_listing"."sold_date" < '2018-01-21'::date
AND "map_listing"."sold_date" IS NOT NULL)
AND NOT (("map_listing"."status" = 'Ter' OR "map_listing"."status" = 'Exp'))
AND NOT (("map_listing"."property_type" = 'Parking Space' OR "map_listing"."property_type" = 'Locker')));
对上述语句执行EXPLAIN (ANALYZE, BUFFERS)的结果(production):
Result of doing EXPLAIN (ANALYZE, BUFFERS) on the above statement (production):
 Aggregate  (cost=89924.55..89924.56 rows=1 width=0) (actual time=27318.859..27318.860 rows=1 loops=1)
   Buffers: shared read=73424
   ->  Bitmap Heap Scan on map_listing  (cost=4873.96..89836.85 rows=35079 width=0) (actual time=6061.214..27315.183 rows=3228 loops=1)
         Recheck Cond: ((la > 43.640279060122346) AND (la < 43.774544561921296))
         Rows Removed by Index Recheck: 86733
         Filter: ((lo < '-79.32516245458987'::numeric) AND (lo > '-79.60531382177737'::numeric) AND ((status)::text <> 'Ter'::text) AND ((status)::text <> 'Exp'::text) AND ((property_type)::text <> 'Parking Space'::text) AND ((property_type)::text <> 'Locker'::text) AND ((transaction_type)::text = 'Sale'::text) AND (((status)::text <> 'Sld'::text) OR (sold_date >= '2018-01-21'::date) OR (sold_date IS NULL)))
         Rows Removed by Filter: 190108
         Heap Blocks: exact=46091 lossy=26592
         Buffers: shared read=73424
         ->  Bitmap Index Scan on map_listing_la_88ca396c  (cost=0.00..4865.19 rows=192477 width=0) (actual time=156.964..156.964 rows=194434 loops=1)
               Index Cond: ((la > 43.640279060122346) AND (la < 43.774544561921296))
               Buffers: shared read=741
 Planning time: 0.546 ms
 Execution time: 27318.926 ms
(14 rows)
<小时>
EXPLAIN (ANALYZE, BUFFERS) (开发)的结果:
 Aggregate  (cost=95326.23..95326.24 rows=1 width=8) (actual time=495.373..495.373 rows=1 loops=1)
   Buffers: shared read=77281
   ->  Bitmap Heap Scan on map_listing  (cost=5211.98..95225.57 rows=40265 width=0) (actual time=80.929..495.140 rows=4565 loops=1)
         Recheck Cond: ((la > 43.640279060122346) AND (la < 43.774544561921296))
         Rows Removed by Index Recheck: 85958
         Filter: ((lo < '-79.32516245458987'::numeric) AND (lo > '-79.60531382177737'::numeric) AND ((status)::text <> 'Ter'::text) AND ((status)::text <> 'Exp'::text) AND ((property_type)::text <> 'P
arking Space'::text) AND ((property_type)::text <> 'Locker'::text) AND ((transaction_type)::text = 'Sale'::text) AND (((status)::text <> 'Sld'::text) OR (sold_date >= '2018-01-21'::date) OR (sold_date
 IS NULL)))
         Rows Removed by Filter: 198033
         Heap Blocks: exact=49858 lossy=26639
         Buffers: shared read=77281
         ->  Bitmap Index Scan on map_listing_la_88ca396c  (cost=0.00..5201.91 rows=205749 width=0) (actual time=73.070..73.070 rows=205569 loops=1)
               Index Cond: ((la > 43.640279060122346) AND (la < 43.774544561921296))
               Buffers: shared read=784
 Planning time: 0.962 ms
 Execution time: 495.822 ms
(14 rows)
推荐答案
此查询未产生任何磁盘 I/O –所有块都从共享缓冲区中读取.但由于查询读取了 73424 个块(约 574 MB),因此在不缓存表时会产生大量 I/O 负载.
This query did not produce any disk I/O – all the blocks are read from shared buffers. But since the query reads 73424 blocks (about 574 MB), it will produce substantial I/O load when the table is not cached.
但是有两件事可以改进.
But there are two things that can be improved.
您在堆扫描中有有损块匹配.这意味着
work_mem不足以包含每个表行一个位的位图,而是 26592 位映射一个表块.必须重新检查所有行,丢弃 86733 行,其中大部分是有损块匹配的误报.
You have lossy block matches in the heap scan. That means that
work_memis not big enough to contain a bitmap with a bit per table row, and 26592 bits map a table block instead. All the rows have to be rechecked, and 86733 rows are discarded, most of which are false positives from the lossy block matches.
如果增加work_mem,每个表行一个位的位图将放入内存,而这个数字会缩小,减少堆扫描期间的工作.
If you increase work_mem, a bitmap with a bit per table row will fit into memory, and this number will shrink, reducing the work during the heap scan.
190108 行被丢弃,因为它们与位图堆扫描中的附加过滤条件不匹配.这可能是花费大部分时间的地方.如果你能减少那个数量,你就会赢.
190108 rows are discarded because they do not match the additional filter condition in the bitmap heap scan. This is probably where most of the time is spent. If you can reduce that amount, you will win.
此查询的理想索引是:
CREATE INDEX ON map_listing(transaction_type, la);
CREATE INDEX ON map_listing(transaction_type, lo);
如果 transaction_type 不是很有选择性(即,大多数行的值为 Sale),您可以省略该列.
If transaction_type is not very selective (i.e., most rows have the value Sale), you can omit that column.
对vmstat 和iostat 的检查表明,CPU 和 I/O 子系统都遭受了大量过载:所有 CPU 资源都花在了 I/O 等待和VM窃取时间.您需要更好的 I/O 系统和具有更多空闲 CPU 资源的主机系统.增加 RAM migjt 缓解了 I/O 问题,但仅限于磁盘读取.
Examination of vmstat and iostat shows that both CPU and the I/O subsystem are suffering from massive overload: all the CPU resources are spent on I/O wait and VM steal time. You need a better I/O system and a host system with more free CPU resources. Increasing RAM migjt alleviate the I/O problem, but only for the disk reads.
这篇关于生产中的 Postgres 查询导致磁盘读取 I/O 异常高的文章就介绍到这了,希望我们推荐的答案对大家有所帮助,也希望大家多多支持IT屋!
