在R中的最小二乘回归图中绘制垂直偏移 [英] Graphing perpendicular offsets in a least squares regression plot in R
问题描述
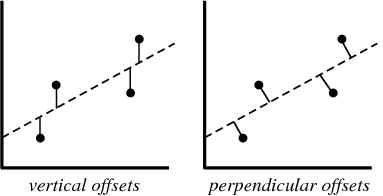
我感兴趣的是制作一个具有最小二乘回归线和将数据点连接到回归线的线段的图,如此处称为垂直偏移的图形所示:
http://mathworld.wolfram.com/LeastSquaresFitting.html
(摘自MathWorld-Wolfram网络资源: wolfram.com )
I'm interested in making a plot with a least squares regression line and line segments connecting the datapoints to the regression line as illustrated here in the graphic called perpendicular offsets:
http://mathworld.wolfram.com/LeastSquaresFitting.html
(from MathWorld - A Wolfram Web Resource: wolfram.com)
我在这里完成了图线和回归线:
I have the plot and regression line done here:
## Dataset from http://www.apsnet.org/education/advancedplantpath/topics/RModules/doc1/04_Linear_regression.html

## Disease severity as a function of temperature

# Response variable, disease severity
diseasesev<-c(1.9,3.1,3.3,4.8,5.3,6.1,6.4,7.6,9.8,12.4)

# Predictor variable, (Centigrade)
temperature<-c(2,1,5,5,20,20,23,10,30,25)

## For convenience, the data may be formatted into a dataframe
severity <- as.data.frame(cbind(diseasesev,temperature))

## Fit a linear model for the data and summarize the output from function lm()
severity.lm <- lm(diseasesev~temperature,data=severity)

# Take a look at the data
plot(
 diseasesev~temperature,
        data=severity,
        xlab="Temperature",
        ylab="% Disease Severity",
        pch=16,
        pty="s",
        xlim=c(0,30),
        ylim=c(0,30)
)
abline(severity.lm,lty=1)
title(main="Graph of % Disease Severity vs Temperature")
Should I use some kind of for loop and segments http://www.iiap.res.in/astrostat/School07/R/html/graphics/html/segments.html to do the perpendicular offsets? Is there a more efficient way? Please provide an example if possible.
推荐答案
您首先需要弄清楚垂直线段底部的坐标,然后调用segments函数,该函数可以将坐标矢量作为输入(否需要循环).
You first need to figure out the coordinates for the base of the perpendicular segments, then call the segments function which can take vectors of coordinates as inputs (no need for a loop).
perp.segment.coord <- function(x0, y0, lm.mod){
 #finds endpoint for a perpendicular segment from the point (x0,y0) to the line
 # defined by lm.mod as y=a+b*x
  a <- coef(lm.mod)[1]  #intercept
  b <- coef(lm.mod)[2]  #slope
  x1 <- (x0+b*y0-a*b)/(1+b^2)
  y1 <- a + b*x1
  list(x0=x0, y0=y0, x1=x1, y1=y1)
}
现在只需调用细分:
ss <- perp.segment.coord(temperature, diseasesev, severity.lm)
do.call(segments, ss)
#which is the same as:
segments(x0=ss$x0, x1=ss$x1, y0=ss$y0, y1=ss$y1)
请注意,除非您确保绘图的x单位和y单位具有相同的视在长度(等轴刻度),否则结果将看起来不是垂直的.您可以通过使用pty="s"来获取正方形图并将xlim和ylim设置为相同范围来实现.
Note that the results will not look perpendicular unless you ensure that the x-unit and y-unit of your plot have the same apparent length (isometric scales). You can do that by using pty="s" to get a square plot and set xlim and ylim to the same range.
这篇关于在R中的最小二乘回归图中绘制垂直偏移的文章就介绍到这了,希望我们推荐的答案对大家有所帮助,也希望大家多多支持IT屋!
