改善graphviz布局 [英] Improving graphviz layout
问题描述
在制作图形时,我完全瘫痪了.如果尚未完全探讨视觉的对称性,那么我将很难理解所发生的事情.我也是一个非常视觉化的学习者,我喜欢简化我刚刚学到的东西并将它们画在纸上.
I have perfection paralysis when it comes to producing something graphic. If symmetries of the visual have not been fully explored, I have a harder time comprehending what is going on. I am a very visual learner as well, and I LOVE to simplify things that I just learned and draw them on paper.
Graphviz是一个很好的自动绘制内容的工具,但它可能会更好.让我们从一个很好的图的例子开始(状态机而不是状态机).没关系,质量(可以使用更好的工具重绘)几乎是完美的,除了我将其逆时针旋转45度以使对称性变得明显.然后,应该使读者花费更少的时间来了解状态q1和q2的相似之处以及它们之间的区别.我认为,鉴于该图旁边没有其他图形片段,因此有一种表示该图的最佳方法.
Graphviz is a nice tool to draw thing automatically, but it could be better. Let's start with an example of a good graph )a state machine rather). Never mind the quality (it can be redrawn with a better tool) this one is almost perfect, except that I would turn it counter-clockwise 45 degrees to make the symmetry apparent. It should then take the reader less time to figure out how the states q1 and q2 are similar and how where they differ. I argue that there is a single best way to represent that diagram, given that there are no other pieces of graphic next to it.
(来源: gallery.hd.org )
(source: gallery.hd.org)
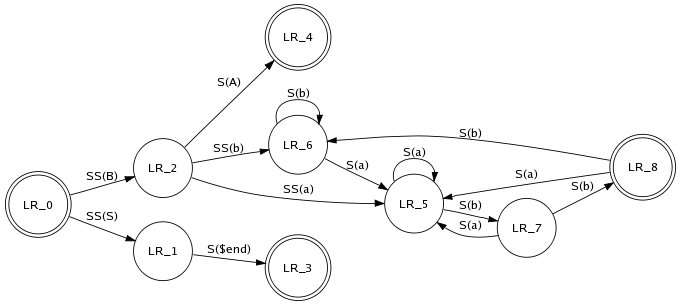
现在让我们来看一个不太完美的描述:
Now let's look at a less than perfect depiction:
(来源: softpedia.com )
(source: softpedia.com)
这看起来像是graphviz会生成的东西.是的,边缘很光滑,但是GAAAAWWWD这是不必要的混淆!它看起来像是思维导图,而不是成品图可供使用.我相信人眼渴望(不亚于)对称.是的,等级制度等也是重要因素.
This looks like something a graphviz would generate. Yes, the edges are smooth but GAAAAWWWD this is unnecessary confusing! It looks like a mind map, not a finished diagram ready for consumption. I believe that human eyes CRAVE (no less) symmetry. Yes, hierarchy, etc. are also important factors.
令我惊讶的是,没有更好的算法可用.有些人根本不是视觉学习者.他们可以通过阅读符号来掌握抽象概念.不是我!
I am surprised that there aren't better algorithms available. Some people are not visual learners at all; they can grasp abstract concepts by reading symbols. Not me!
那么,我的问题是什么?那么,是否有更好的免费软件可用于绘制中小型图形?也许
So, what is my question? Well, is there better free software available for drawing small-to-medium graphs? Perhaps
谢谢!
让我知道如何改进这篇文章.
Let me know how I can improve this post.
P.S.我花了10分钟在dia上画出了一个足够类似的克隆.它仍然不是完美的,但是制作起来很方便,因为所有内容都可以对齐到网格(我错过了一些小细节,但是不想重新上传). LR_0需要一个"Start --->"从上方来,以便用户更快地掌握启动状态.
P.S. I took 10 minutes to draw out a similar enough clone in dia. It is still not perfect, but it was convenient to make because everything snaps to grid (and I missed a few little details but do not feel like re-uploading). The LR_0 needs a "Start--->" coming from above to let the user grasp the starting state sooner.
推荐答案
几次尝试绘制图形并未能获得您认为最佳"的布局后,您在这里提出了一个问题: 是那里有[[更好的免费软件[用于]绘制中小型图形.] .您给出的评估布局算法的唯一标准是它们与"[s]的接近程度". ingle代表该图的最佳方法."当然,最佳"留给您决定.
After several attempts at drawing your graph and failing to get a layout that you deem "best", you posed the question here: is there "[b]etter free software [for] drawing small-to-medium graphs." The sole criterion you've given for evaluating layout algorithms is how closely they come to the "[s]ingle best way to represent that diagram." "Best" of course, left for you to decide.
这与尝试使用给定的编程语言解决问题,失败然后请求更好的编程语言几乎相同.
This is more or less the same as attempting to solve a problem using a given programming language, failing, and then asking for a better programming language.
图形绘制算法的核心是优化例程,该例程生成然后评估的解决方案(此处的解决方案"是指每个节点的坐标,这些坐标共同组成一个布局).这些解决方案是根据单个准则或一系列排名准则的最小化(即,图形的一个或多个属性的最小化)进行评估的,例如,交叉的边总数或距离之和节点之间(或两者的组合,或这两个的某种加权组合)之间的距离,或与对称配置的接近程度. Graphviz由六种不同的布局算法组成(点neato,fdp,sfdp,twopi和circo).其中,似乎只用了点.但是,考虑到严格的对称性约束,twopi和circo可能是更好的选择,这似乎与您自己正确绘制图形的想法相符.
At the heart of graph drawing algorithms are optimization routines that generate then evaluation solutions ('solution' here refers to the coordinates for each node which together comprise a layout). Those solutions are evaluated according to minimization of a single criterion or a series of ranked criteria--i.e., the minimization of one or more attributes of the graph--for instance, the total number of edges that cross, or the sum of the distances between nodes (or the combination of both, or some weighted combination of those two), or the closeness to a symmetrical configuration. Graphviz is comprised of six different layout algorithms (dot neato, fdp, sfdp, twopi, and circo). Of these, it appears you only used dot; however, twopi and circo might have been better options given their strict symmetry constraints which appear to match your own idea of a correctly drawn graph.
第二,您的问题的文本直接针对图形"和图形绘制.在阅读了完整的说明之后,我认为您的问题与这两个概念均无关.
Second, the text of your question is directed to "graphs" and graph-drawing, After reading your full description, i don't think your question has anything to do with either concept.
除了一般的图形绘制算法(例如graphviz)之外,还有许多特定于领域的布局算法,例如,Hasse图(以顺序理论表示部分有序集),Barabasi-Albert图(无标度网络) )和Erdos-Renyi(随机图).这些算法中的每一种都会根据域提供的条件和约束来生成图形布局-这应该向您指示在所有域中都没有一个最佳"布局.尽管您在问题中使用了图形"一词,但是您的描述仍表明您的问题与绘制状态机有关,图形状态机是一种高度特殊的图形类型.通用图绘制算法通常不擅长绘制此类专用图,因为该算法对领域一无所知.实际上,我不知道用于状态图的任何布局算法-就像没有用于流程图的布局算法一样(不一样,但相似).在工作流程方面,您可以在graphviz中绘制图形,然后将其导入到Omnigraffle中进行微调-在Omnigraffle中,您可以对节点和边的位置进行细粒度的控制.
Beyond the general graph drawing algorithms (like graphviz), there are a number of domain-specific layout algorithms, for instance, Hasse diagrams (to represent partially ordered sets in order theory), Barabasi-Albert graphs (scale-free networks), and Erdos-Renyi (random graphs). Each of those algorithms produces a graph layout based on criteria and constraints supplied by the domain--this ought to indicate to you that there is not a single "best" layout across all domains. Although you used the term "graph" in your question, your description indicates that your problem relates to drawing state machines--a highly idiosyncratic type of graph. General graph drawing algorithms are often poor at drawing specialized graphs of this sort because the algorithm knows nothing about domain. In fact, I'm not aware of any layout algorithm for state diagrams--just like there isn't one for flow diagrams (not the same, but similar). Workflow-wise, you might draw the graph in graphviz then import it to Omnigraffle for fine tuning--in Omnigraffle, you'll have fine-grained control over the node and edge placements.
这篇关于改善graphviz布局的文章就介绍到这了,希望我们推荐的答案对大家有所帮助,也希望大家多多支持IT屋!
