statsmodels:一起打印多个回归模型的摘要 [英] statsmodels: printing summary of more than one regression models together
问题描述
在Python库Statsmodels中,可以用print(results.summary())将回归结果打印出来,如何打印出超过一张表中的一个回归,以便更好地比较?
In the Python library Statsmodels, you can print out the regression results with print(results.summary()), how can I print out the summary of more than one regressions in one table, for better comparison?
线性回归,代码取自 statsmodels 文档:
A linear regression, code taken from statsmodels documentation:
nsample = 100
x = np.linspace(0, 10, 100)
X = np.column_stack((x, x**2))
beta = np.array([0.1, 10])
e = np.random.normal(size=nsample)
y = np.dot(X, beta) + e

model = sm.OLS(y, X)
results_noconstant = model.fit()
然后我向模型添加一个常量并再次运行回归:
Then I add a constant to the model and run the regression again:
beta = np.array([1, 0.1, 10])
X = sm.add_constant(X)
y = np.dot(X, beta) + e

model = sm.OLS(y, X)
results_withconstant = model.fit()
我想在一张表格中看到 results_noconstant 和 results_withconstant 的摘要.这应该是一个非常有用的功能,但我在 statsmodels 文档中没有找到任何相关说明.
I'd like to see the summaries of results_noconstant and results_withconstant printed out in one table. This should be a very useful function, but I didn't find any instruction about this in the statsmodels documentation.
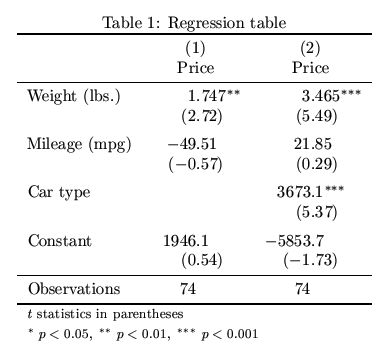
编辑:我想到的回归表类似于 这个,不知道有没有现成的功能可以做到这一点.
EDIT: The regression table I had in mind would be something like this, I wonder whether there is ready-made functionality to do this.
推荐答案
我相信有很多方法可以做到这一点.取决于您可以/想要使用什么来实现这一目标.
I am sure there are number of ways to do that. Depends on what you can / want use to achieve that.
起点很可能是相同的:
statsmodels 'linear_model'.fit() 返回 RegressionResults 类,它有 summary2() 方法返回子类几个方便的方法.
statsmodels 'linear_model'.fit() returns RegressionResults class, which has summary2() method returning subclass with a few convenice methods.
其中之一,例如,.tables 返回 pandas.DataFrame.
One of which, for example, .tables returns pandas.DataFrame.
以下是您可以使用它的方法:
Here is how you could use this:
import pandas as pd
results = {'Noconst':results_noconstant.summary2(),
           'withcon':results_withconstant.summary2()}
df = pd.DataFrame({'Model':[], 'Param':[], 'Value':[]})
for mod in results.keys():
    for col in results[mod].tables[0].columns:
        if col % 2 == 0:
            df = df.append(pd.DataFrame({'Model': [mod]*results[mod].tables[0][col].size,
                                         'Param':results[mod].tables[0][col].values,
                                         'Value':results[mod].tables[0][col+1].values}))

print df
产生的结果:
     Model                Param             Value
0  Noconst               Model:               OLS
1  Noconst  Dependent Variable:                 y
2  Noconst                Date:  2016-01-29 00:33
3  Noconst    No. Observations:               100
4  Noconst            Df Model:                 2
5  Noconst        Df Residuals:                98
6  Noconst           R-squared:             1.000
0  Noconst      Adj. R-squared:             1.000
1  Noconst                 AIC:          296.0102
2  Noconst                 BIC:          301.2205
3  Noconst      Log-Likelihood:           -146.01
4  Noconst         F-statistic:         9.182e+06
5  Noconst  Prob (F-statistic):         4.33e-259
6  Noconst               Scale:            1.1079
0  withcon               Model:               OLS
1  withcon  Dependent Variable:                 y
2  withcon                Date:  2016-01-29 00:33
3  withcon    No. Observations:               100
4  withcon            Df Model:                 2
5  withcon        Df Residuals:                97
6  withcon           R-squared:             1.000
0  withcon      Adj. R-squared:             1.000
1  withcon                 AIC:          297.8065
2  withcon                 BIC:          305.6220
3  withcon      Log-Likelihood:           -145.90
4  withcon         F-statistic:         4.071e+06
5  withcon  Prob (F-statistic):         1.55e-239
6  withcon               Scale:            1.1170
你可以用它做什么只受你使用熊猫的能力的限制 - 强大的 Python 数据分析工具包.
What you can do with this is only limited by your ability to use pandas - powerful Python data analysis toolkit.
这篇关于statsmodels:一起打印多个回归模型的摘要的文章就介绍到这了,希望我们推荐的答案对大家有所帮助,也希望大家多多支持IT屋!
