D3.js 分组条形图 [英] D3.js grouped bar chart
问题描述
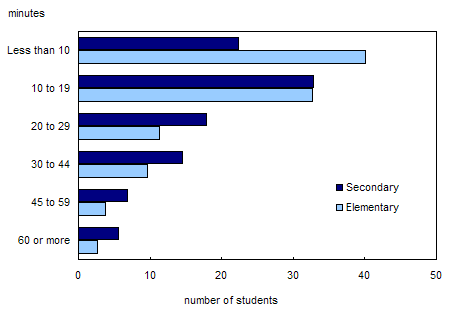
我正在使用 D3.js 制作条形图,如下所示
(来源:statcan.gc.ca)
I am making a bar chart using D3.js like this
(source: statcan.gc.ca)
但它应该是垂直的.所以我可以通过两组数据进行比较.我使用 http://bost.ocks.org/mike/bar/2/中的教程,为了进行比较,我建立了两个类,chart"和chart1"并分别给它们数据,但它只显示第一个svg图表.问题是什么?这是代码http://jsfiddle.net/x8rax/
but it is supposed to be vertical. so I can show comparison through two sets of data. I use the tutorial from http://bost.ocks.org/mike/bar/2/, to make the comparison,I build two classes, "chart" and "chart1" and give them data separately, but it only shows the first svg charts. What is the problem? Here is the code http://jsfiddle.net/x8rax/
<meta charset="utf-8">
<style>

.chart rect {
  fill: rgb(203, 232, 118);
}

.chart2 rect {
  fill: rgb(50, 50, 50);
}

.chart text {
  fill: white;
  font: 10px sans-serif;
  text-anchor: end;
}

</style>
<svg class="chart"></svg>
<script src="http://d3js.org/d3.v3.min.js"></script>
<script>

var data = [4, 8, 15, 16, 23, 42];


var width = 420,
    barHeight = 80;

var x = d3.scale.linear()
    .domain([0, d3.max(data)])
    .range([0, width]);


var chart = d3.select(".chart")
    .attr("width", width)
    .attr("height", barHeight * data.length);


var bar = chart.selectAll("g")
    .data(data)
  .enter().append("g")
    .attr("transform", function(d, i) { return "translate(0," + i * barHeight +")"; });

bar.append("rect")
    .attr("width", x)
    .attr("height", barHeight - 60);


bar.append("text")
    .attr("x", function(d) { return x(d) - 3; })
    .attr("y", barHeight / 2)
    .attr("dy", ".35em")
    .text(function(d) { return d; });


//data is not so much interesting here.
</script>

<svg class = "chart2"></svg>
<script>
var data2 = [10, 10, 10, 10, 10, 10];

var width = 420,
    barHeight = 80;

var x2 = d3.scale.linear()
    .domain([0, d3.max(data2)])
    .range([0, width]);

var chart2 = d3.select(".chart")
    .attr("width", width)
    .attr("height", barHeight * data.length);

var bar2 = chart.selectAll("g")
    .data(data2)
  .enter().append("g")
    .attr("transform", function(d, i) { return "translate(0," + i * barHeight +")"; });

bar2.append("rect")
    .attr("width", x2)
    .attr("height", barHeight - 60);

</script>
推荐答案
明白了.您在 3 个地方遗漏了第二组变量的名称:
Got it. You left out the names of the second set of variables in 3 places:
1.
var chart2 = d3.select(".chart")(应该是chart2)
2.
.attr("height", barHeight * data.length); (应该是data2)
3.
var bar2 = chart.selectAll("g")(应该是chart2)
将留下我对下面的放置所做的事情.注意 chart 上的 position:absolute 使 chart2 与其重叠.
Will leave what I did with the placing below. Note the position:absolute on chart to make chart2 overlap with it.
您的代码有几个问题,我只是复制了有效的部分并对数据进行了更改.我会尝试找出您代码中的所有问题并编辑我的答案.
Your code has a couple problems, I just copied the part that works and made the changes to the data. I'll try to find all the issues in your code and edit my answer.
现在,这是一个可行的解决方案.我认为导致问题的原因是一些命名混乱,所以我只是覆盖了两个图表的相同变量.一旦附加了 svg 元素,您就真的不需要保留变量了.
For now, here's a working solution. I think what causes problem is some naming confusion so I just overwrite the same variables for both charts. Once svg elements have been appended you don't really need to keep the variables around.
var data = [4, 8, 15, 16, 23, 42];


var width = 420,
    barHeight = 80;

var x = d3.scale.linear()
    .domain([0, d3.max(data)])
    .range([0, width]);


var chart = d3.select(".chart")
    .attr("width", width)
    .attr("height", barHeight * data.length);


var bar = chart.selectAll("g")
    .data(data)
    .enter().append("g")
    .attr("transform", function(d, i) { return "translate(0," + i * barHeight +")"; });

bar.append("rect")
    .attr("width", x)
    .attr("height", barHeight - 60);

var data = [10, 10, 10, 10, 10, 10];


var width = 420,
    barHeight = 80;

var chart = d3.select(".chart2")
    .attr("width", width)
    .attr("height", barHeight * data.length);


var bar = chart.selectAll("g")
    .data(data)
    .enter().append("g")
    .attr("transform", function(d, i) { return "translate(0," + (i * barHeight + barHeight - 60 )  +")"; });

bar.append("rect")
    .attr("width", x)
    .attr("height", barHeight - 60);
这篇关于D3.js 分组条形图的文章就介绍到这了,希望我们推荐的答案对大家有所帮助,也希望大家多多支持IT屋!
