GnuPlot中的三维图(颜色是我的数据文件中的第四列)? [英] 3-Dimensional Plot in GnuPlot where color is a fourth column in my data file?
问题描述
我有一个数据文件,如下所示:
  1 2 3 0.5
 2 8 9 0.2
 3 4 78 0.4
 6 5 7 0.01
 9 9 9 0.3
 10 12 18 0.9
 6 8 4 1
我想做一个这样的图形
为可能的实现)。然后必须运行 wgnuplot_pipes.exe 二进制文件, splot 命令变为
splot sprintf('< python paste.py%s.grid%s.color',dataFile,dataFile)u 1:2:3:7 with pm3d notitle
当然,你必须安装python并且python二进制文件必须通过 PATH 环境变量。
I have a datafile that looks like this:
1   2   3   0.5
2   8   9   0.2
3   4   78  0.4
6   5   7   0.01
9   9   9   0.3
10  12  18  0.9
6   8   4   1
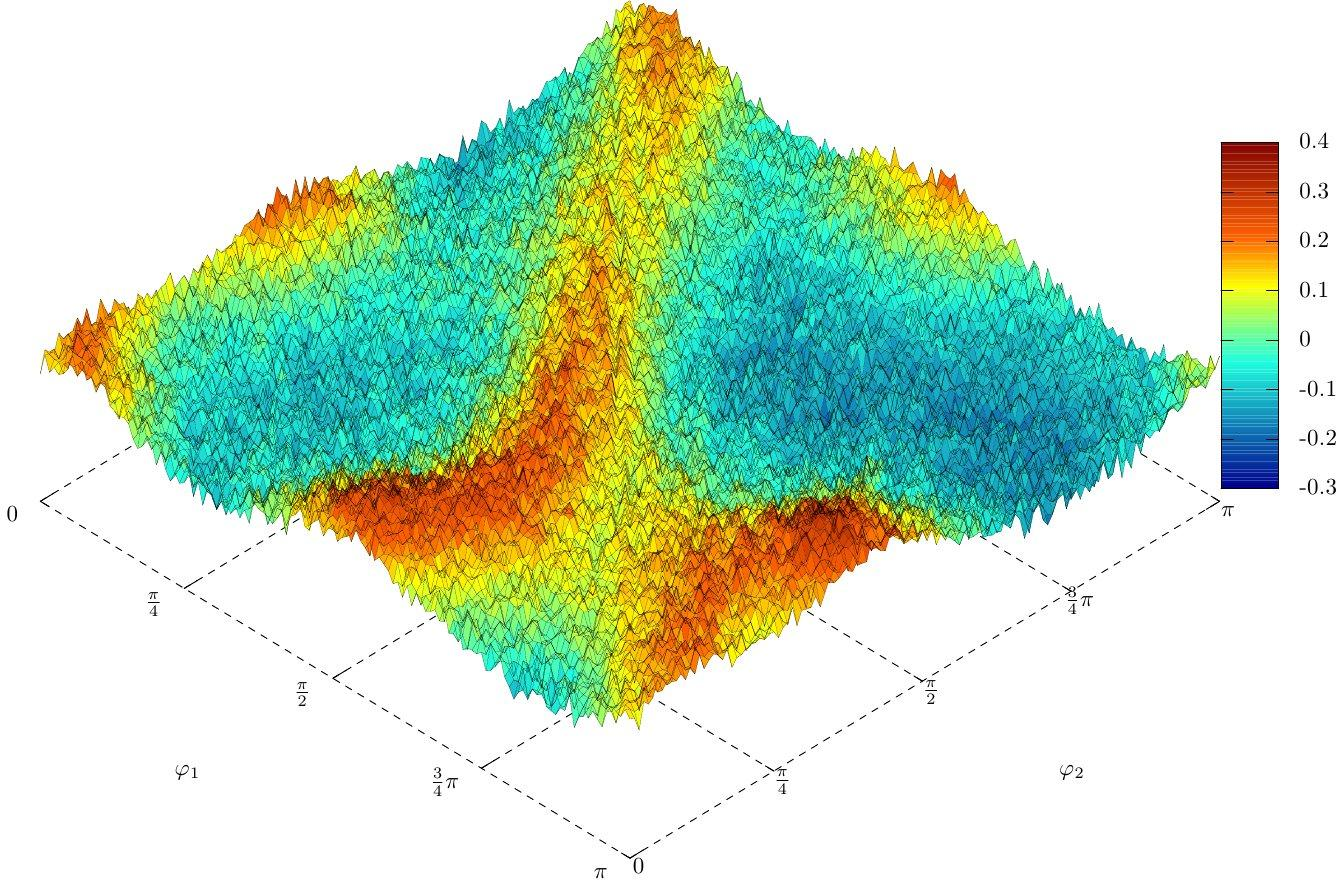
I would like to do a graph like this http://2.bp.blogspot.com/-378_rAaSSVU/UzU0gnGcr9I/AAAAAAAABnU/P1GwP9RKBkM/s1600/gnuplot.png Where the 4th column is the color.
I tried - obviously incorrect because I do not use the fourth column but I failed to find anything in the documentation:
set dgrid3d 30,30
set view 60,45
set hidden3d
dataFile='prova.dat'
set palette defined (0 "blue", 0.5 "white", 1 "pink")
set pm3d
splot dataFile u 1:2:3 with pm3d
Is somethings like that possible?
Using only pm3d you can use a fourth column to select a color independent of the z-value. Together with dgrid3d this is not directly possible, because the gridding is not performed on the color column.
You can use a workaround: First you plot the gridded z-value to one file, then the gridded color values to a second file and as last point you disable dgrid3d, merge the two temporary files on-the-fly and plot their values:
set dgrid3d 30,30
dataFile='prova.dat'

set table dataFile.'.grid'
splot dataFile u 1:2:3
unset table

set table dataFile.'.color'
splot dataFile u 1:2:4
unset table

set view 60,45
set hidden3d
set palette defined (0 "blue", 0.5 "white", 1 "pink")
set autoscale cbfix
set pm3d
unset dgrid3d
set ticslevel 0
splot sprintf('< paste %s.grid %s.color', dataFile, dataFile) u 1:2:3:7 with pm3d notitle
Note, that paste is a command line tool for Unix-like operation systems. For a similar solution for windows, you can e.g. write a small Python script paste.py (see my answer to Get ratio from 2 files in gnuplot for a possible implementation). Then you must run the wgnuplot_pipes.exe binary file and the splot command becomes
splot sprintf('< python paste.py %s.grid %s.color', dataFile, dataFile) u 1:2:3:7 with pm3d notitle
Of course, for this you must have python installed and the python binary must be available via the PATH environment variable.
这篇关于GnuPlot中的三维图(颜色是我的数据文件中的第四列)?的文章就介绍到这了,希望我们推荐的答案对大家有所帮助,也希望大家多多支持IT屋!
